在vscode-jupyter中使用可交互matplotlib
Problem
VSCode中集成的Jupyter Notebook使用非常方便,但是使用matplotlib默认绘制的图是直接呈现的PNG,失去了很多backend特性,不能交互,很不方便。
Solution
实际上Microsoft已经给出相关说明,见相关GitHub Wiki。
VS code should work with these two options (has been thoroughly tested):
%matplotlib inline- This is the default and will render images as PNGs%matplotlib widget- This generates an ipywidget that renders plots in a control. Multiple plots and zooming are supported. For more information see the README
所以简单的加上%matplotlib widget 即可,如果提示缺失ipympl,安装即可。最终效果如下图。
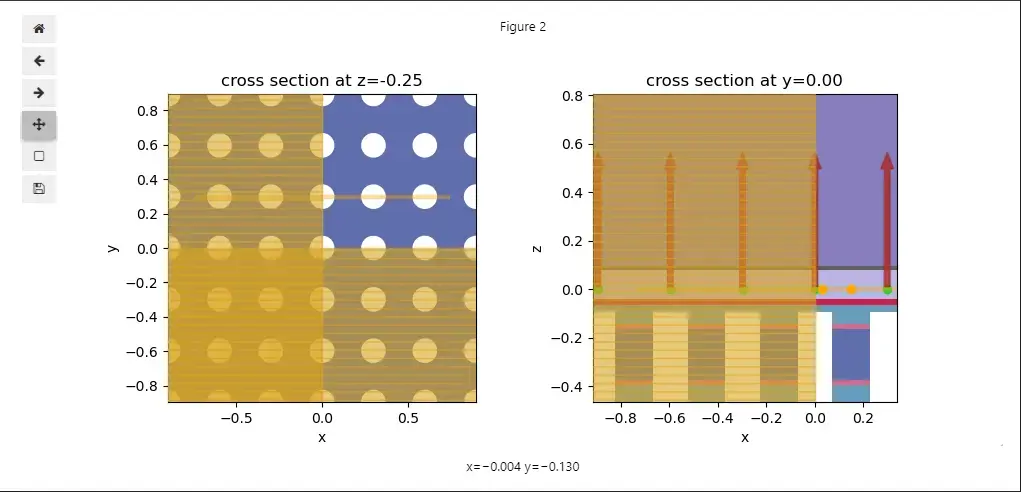
Interactive Window and/or Cell Scripts (.py files with #%% markers)中使用。也可以采用%matplotlib qt5,但是渲染结果一言难尽。- Title: 在vscode-jupyter中使用可交互matplotlib
- Author: Maple
- Created at : 2023-11-08 01:39:42
- Updated at : 2023-11-08 13:39:38
- Link: https://www.maple367.eu.org/Code/Python/Matplotlib/在vscode-jupyter中使用可交互matplotlib/
- License: This work is licensed under CC BY-NC-SA 4.0.
Comments